on
Week 1: Past Elections and Gerrymandering
Welcome to my weekly election blog for the upcoming 2022 midterms in November.The goal of this blog is to create a prediction for both the seat share and the popular vote for each party within the House of Representatives. I will use this blog to explain changes and additions to my prediction model. I will also provide graphics that support my claims and data reasoning.
This first post serves as an introduction to this upcoming election by analyzing the outcomes of past recent midterms. Past elections can indicate patterns and trends that should be accounted for when predicting future elections. The data analyzed in this blog entry addresses voting outcomes at both the district and state level. Although districts elect Representatives, looking at statewide data can provide a more robust outlook at the trends of the state because factors such as redistricting and lack of opposition can limit the accuracy of district voting trends.
National Vote Share
This section will compare the 2014 and 2020 GOP vote share margin. Vote share is calculated by taking total republican votes in a state divided by the sum of the state’s total democratic and republican votes. As the shades of red increases in brightness, this represents the GOP having a larger percentage of the vote share in that state.
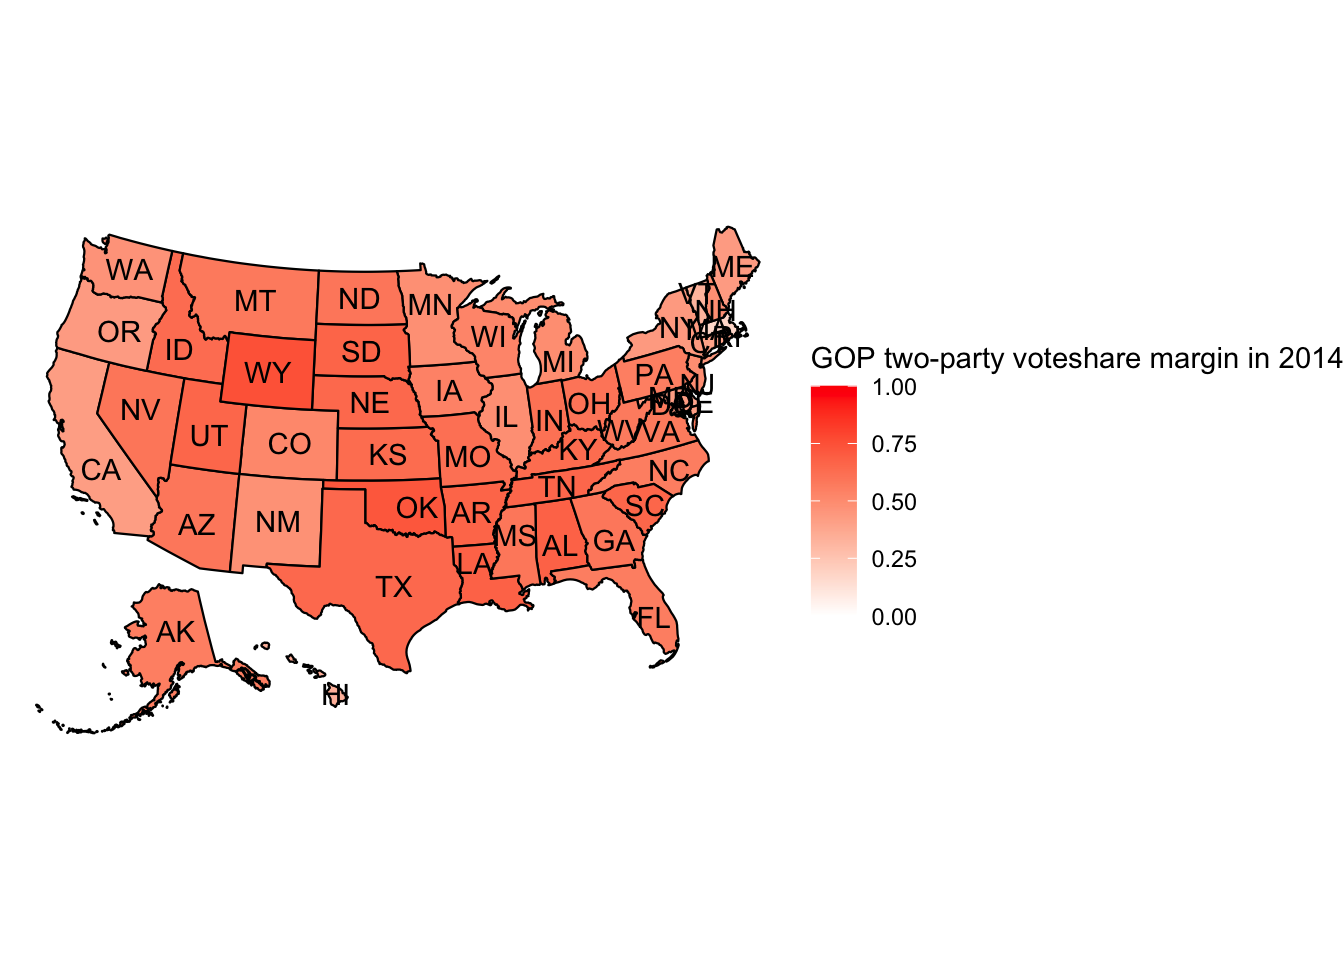
In 2014, noteworthy states include Wyoming and Oklahoma which had the highest GOP vote share margin, 74.94% and 72.45%, respectively. Conversely, Massachusetts and Vermont had the lowest GOP vote share margin, 17.3% and 35.51%, respectively.
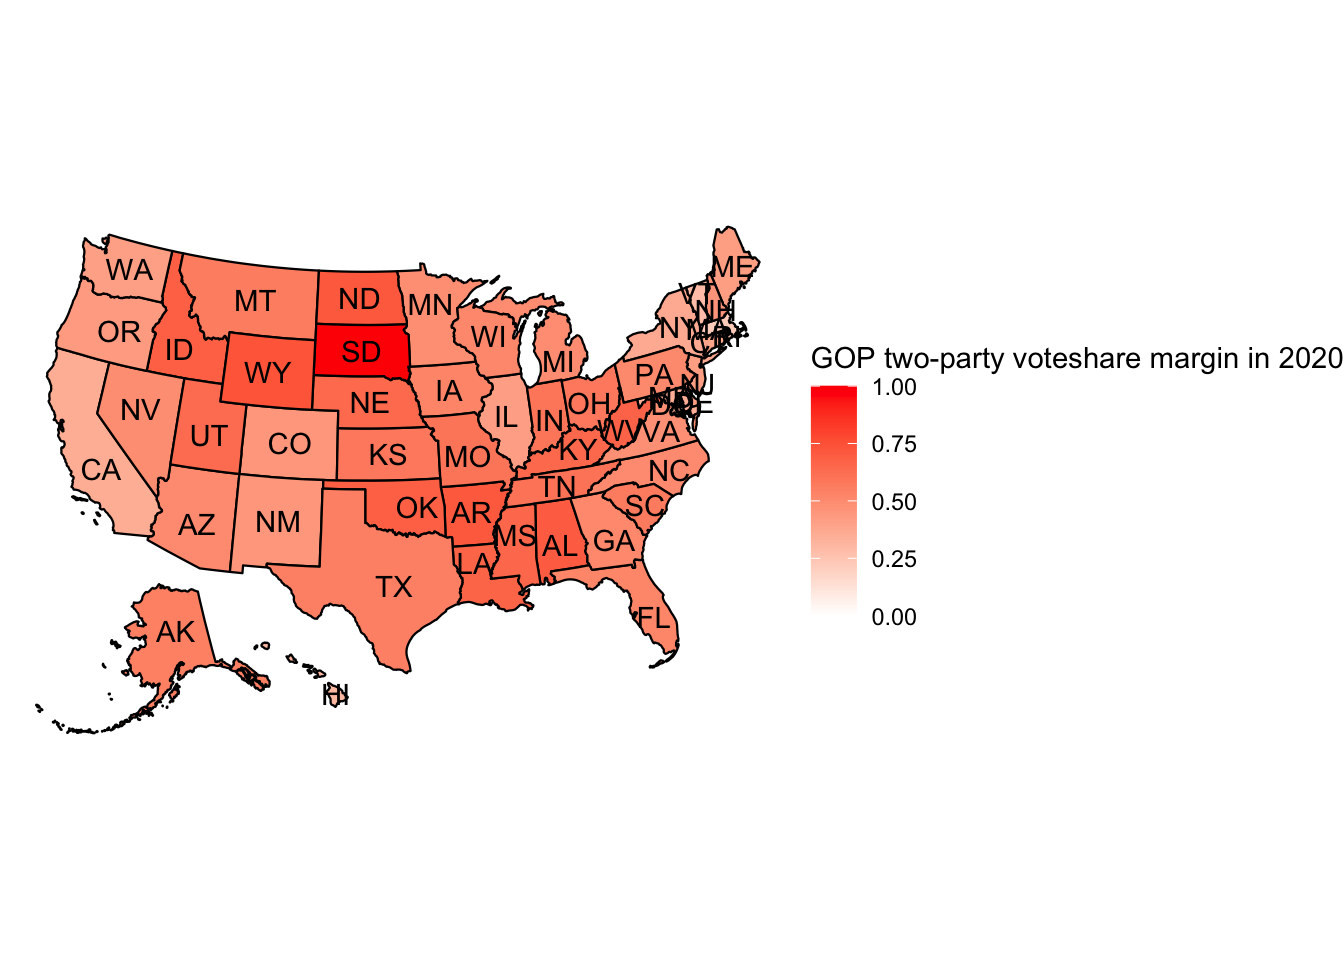
For 2020, the two lowest states of the GOP vote share were in Massachusetts and Rhode Island, 21.97% and 26.01% respectively. The highest were in South Dakota, with 100% and Wyoming with 73.61%. South Dakota’s percentage can be explained by the fact that the one open House seat only had one candidate on the ballot, a republican, therefore eliminating the democratic vote share.
Overall, between 2014 and 2020 we see a general decline in the GOP’s vote share as the color of the map decreases in brightness. When comparing the mean GOP vote share across these years, we see that in 2014, the mean GOP vote share was 53.19%. Looking at 2020, this value dropped to 48.74%. These values corroborate the general visual trend of the map that shows the GOP vote share decreasing between the 2014 and 2020 elections.
Seat share and Gerrymandering
This sections looks at the seat share of the House after the 2020 election. Seat share is calculated by the number of republican seats won in a state divided by the total number of seats available in that state.
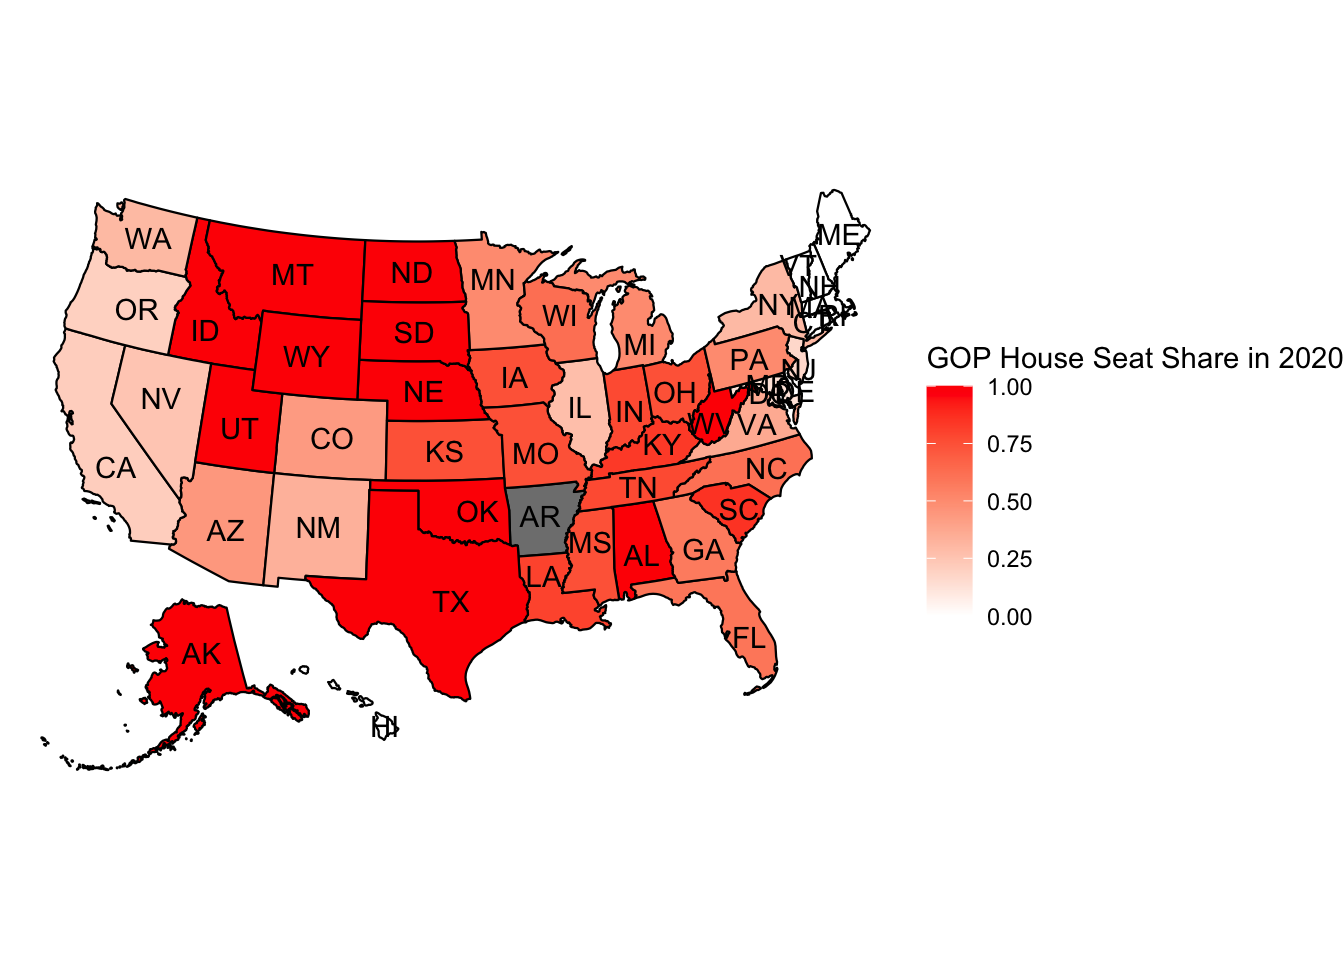
Vote share is an important measurement to consider when predicting election results, however seat share arguably provides a more accurate depiction of the implications of the vote outcomes with regard to the House. Due to plurality voting, popular vote does not equate to the proportion of seats allotted to each party in the House. The map below shows the seat shares after the 2020 election. One state of note is Arkansas, whose data was not included. However, it can be noted that Arkansas had all four seats go to the republicans, making their shade a bright red. Compared to the map of the vote shares, this map is evidently more red, indicating a greater percentage of seats won by republicans than the actual vote share won by republicans. Specifically looking in the mountain west region and the south, there is significant disparity among the color shade for these states between the vote share and seat share graphs. The mean seat share for republicans from the 2020 election was 56.19%. This is 7.44% higher than the mean vote share republicans earned. This difference shows how gerrymandering plays a significant role in elections and has shown to support the republican’s path to gaining seats in the House. This is likely to continue for the 2022 election, as redistricting from the 2020 census has enabled both parties, but largely republicans, to gerrymander districts.
The data analyzed in this week’s blog has shown how gerrymandering can contribute to a major difference between vote share and seat share. It leads me to an initial prediction that seat share will not be equal to vote share, and most likely greater for republicans. Understanding the power of gerrymandering will be essential in predicting an accurate model for the upcoming election.