on
Week 2: Economic Fundamentals
For this week’s blog post, I am looking at the role of the economy in incumbency vote share. The economic variables studied in this post include GDP, RDI, and unemployment rate. These variables are broken down by economic quarter.The question that is framing this week’s post is: What role can economic variables play in predicting incumbency vote share? How does this vary across the different economic variables and between fiscal quarters?
To attempt to answer these questions, data used in this post provides the quarterly GDP growth, unemployment rate, and RDI growth between the years of 1948 and 2020. I then plotted the economic variable against that year’s incumbency vote share and fitted the data to find the linear regression model. I evaluated the quality of this fit by finding the R squared value, which analyzes the difference between the predicted and actual values.
GDP
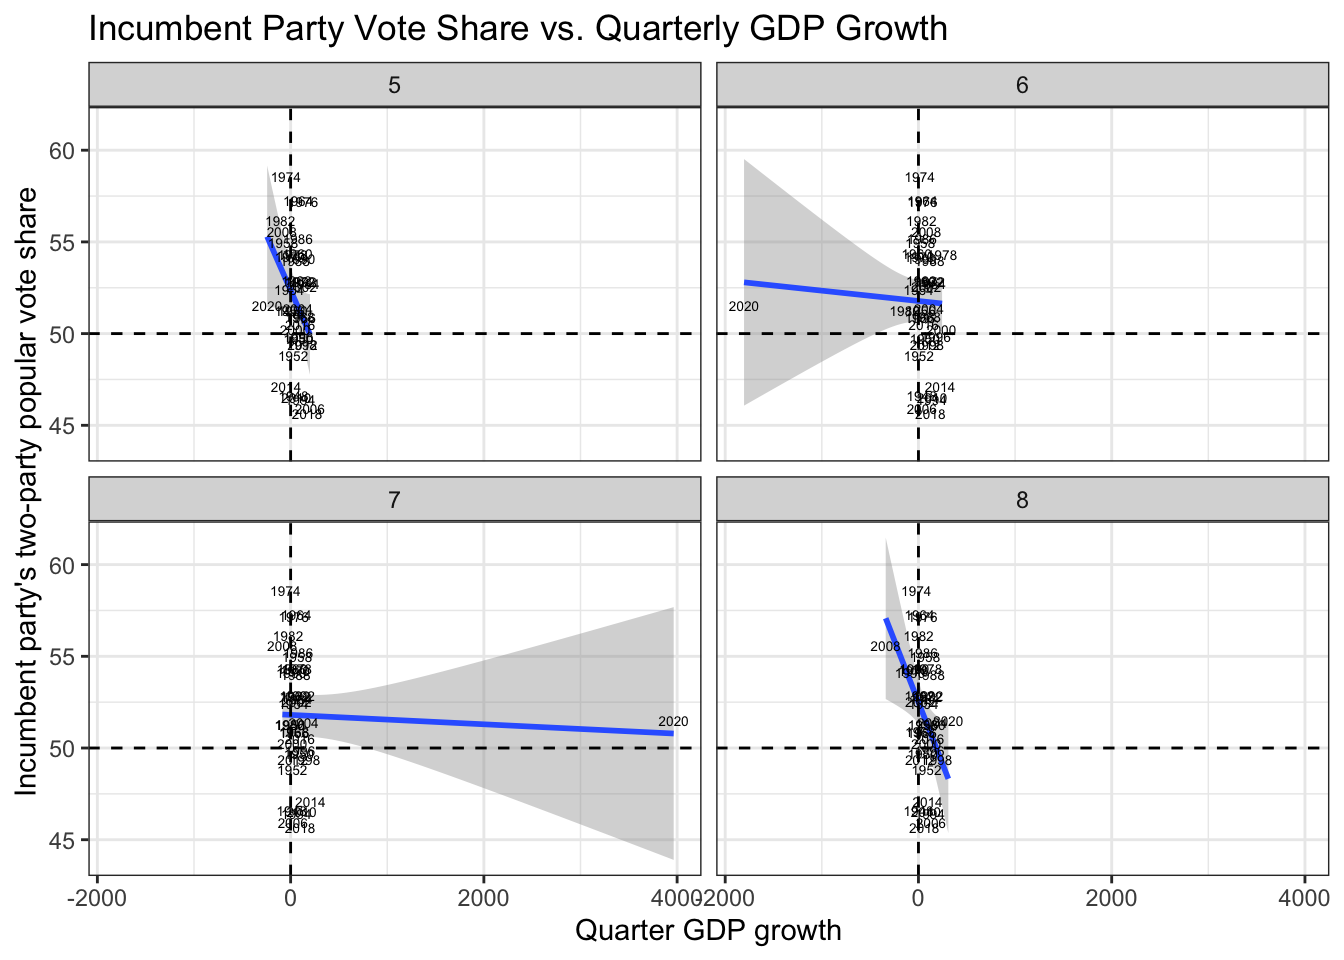
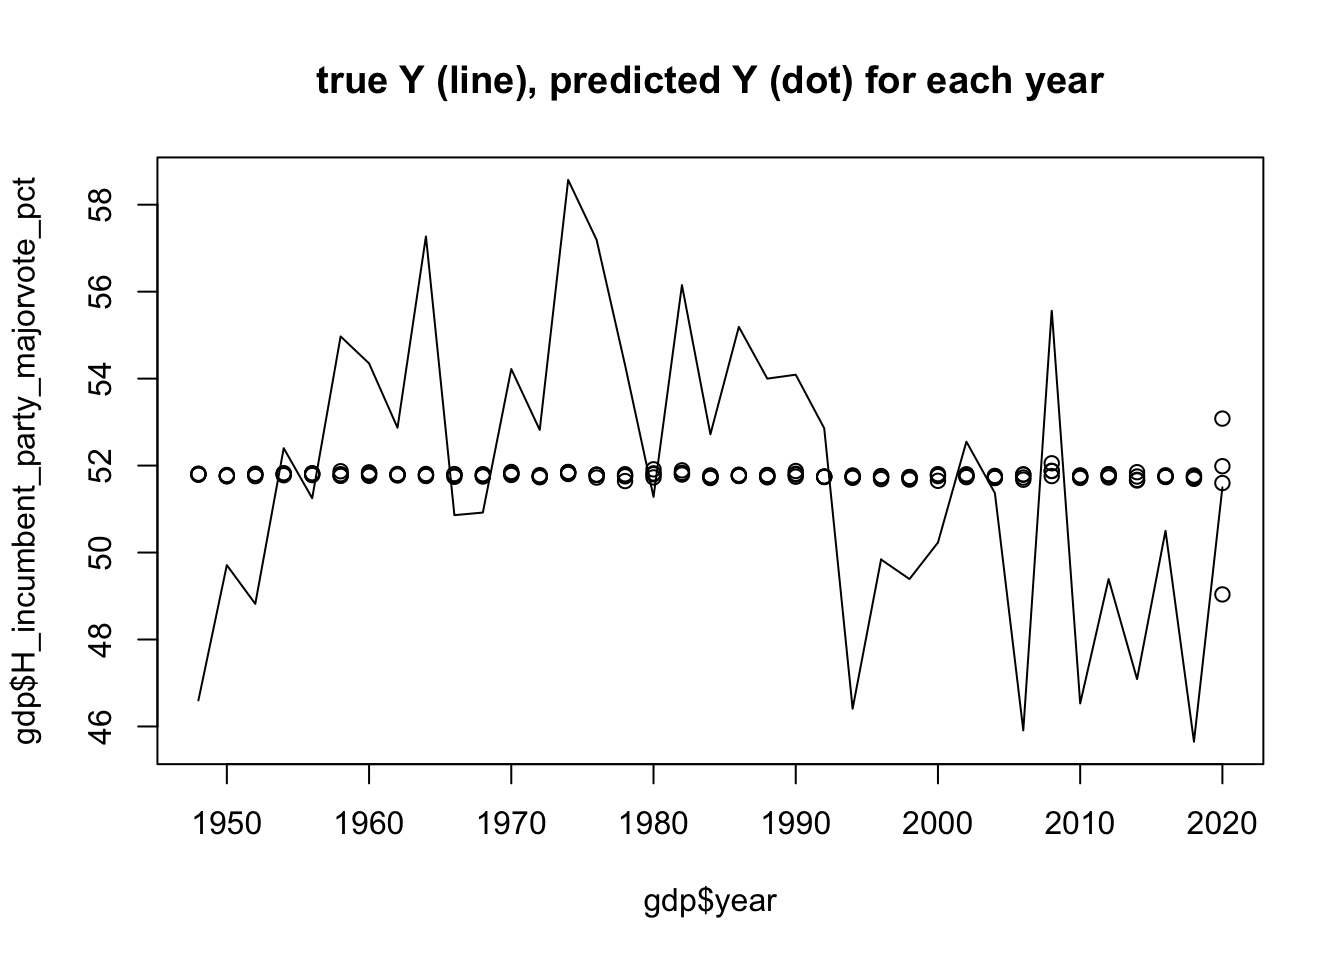 The above graph shows the regression between GDP growth and incumbency for each economic quarter. The quarters are listed from 5 to 8 to present the data from the second year of the election cycle. With midterms every two-years, there are eight total economic quarters. These graphs show a high concentration around the vertical dotted line of x = 0, not displaying linearity. Further, 2020 presents as an evident outlier in quarters 6, 7, and 8. This could be explained by the Covid Pandemic and the drastic impact it had on the economy. Across the quarters, we see that quarter 8 appears to display the strongest correlation between incumbency and GDP growth. If the models were combined, we would predict the incumbency vote share to be 51.82% when GDP was 0 and a -0.07% decline in incumbency for every 1% increase in GDP. However, the R squared value for this fit is .01. This extremely small value indicates little confidence in the ability for GDP to predict incumbency. This can be further seen by the second figure which shows the predicted values as fairly constant, unlike the variance among the actual values.
RDI
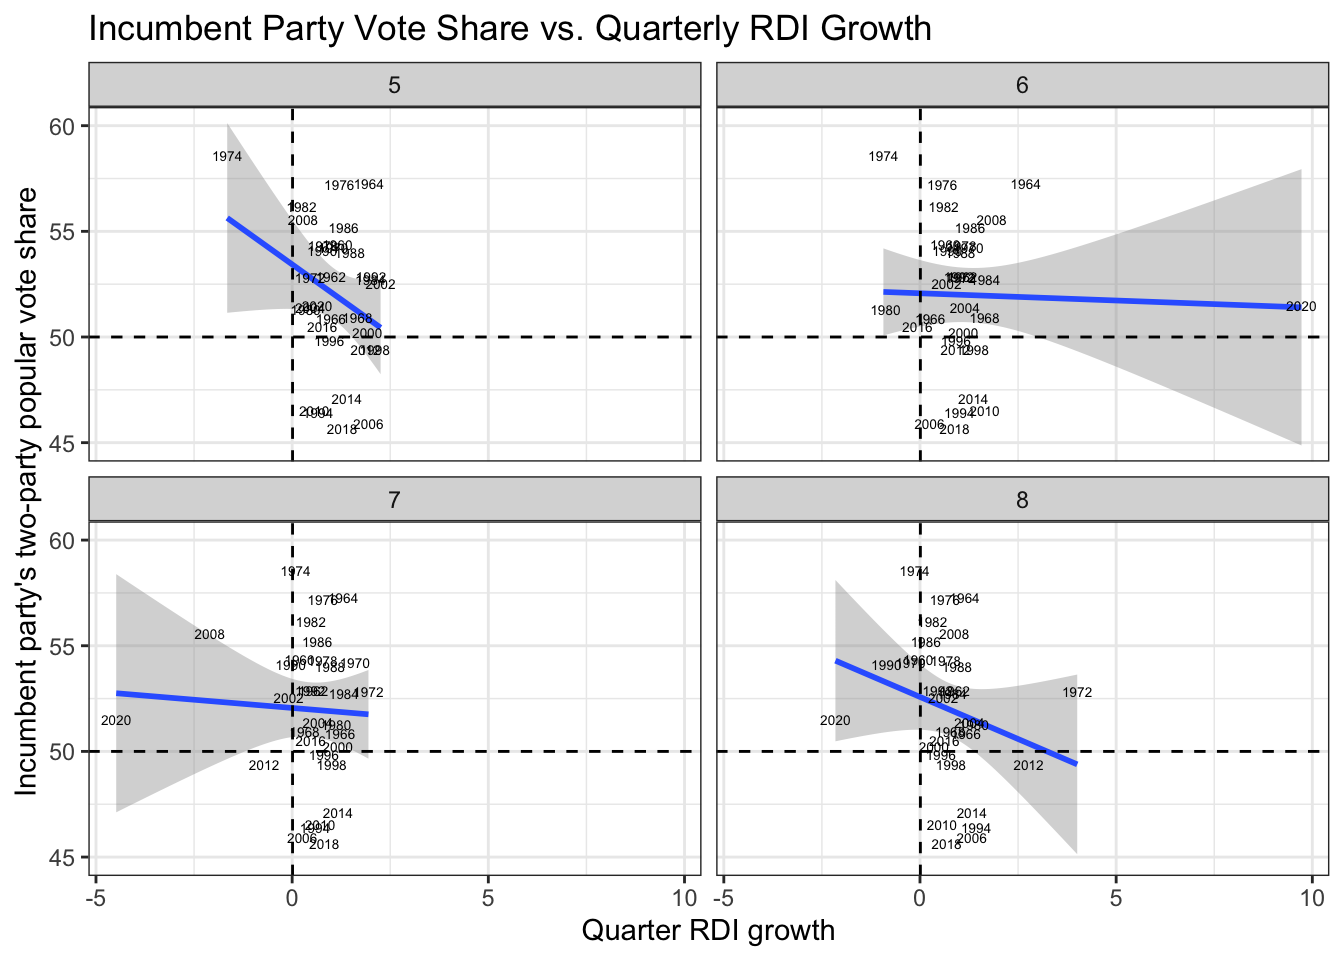
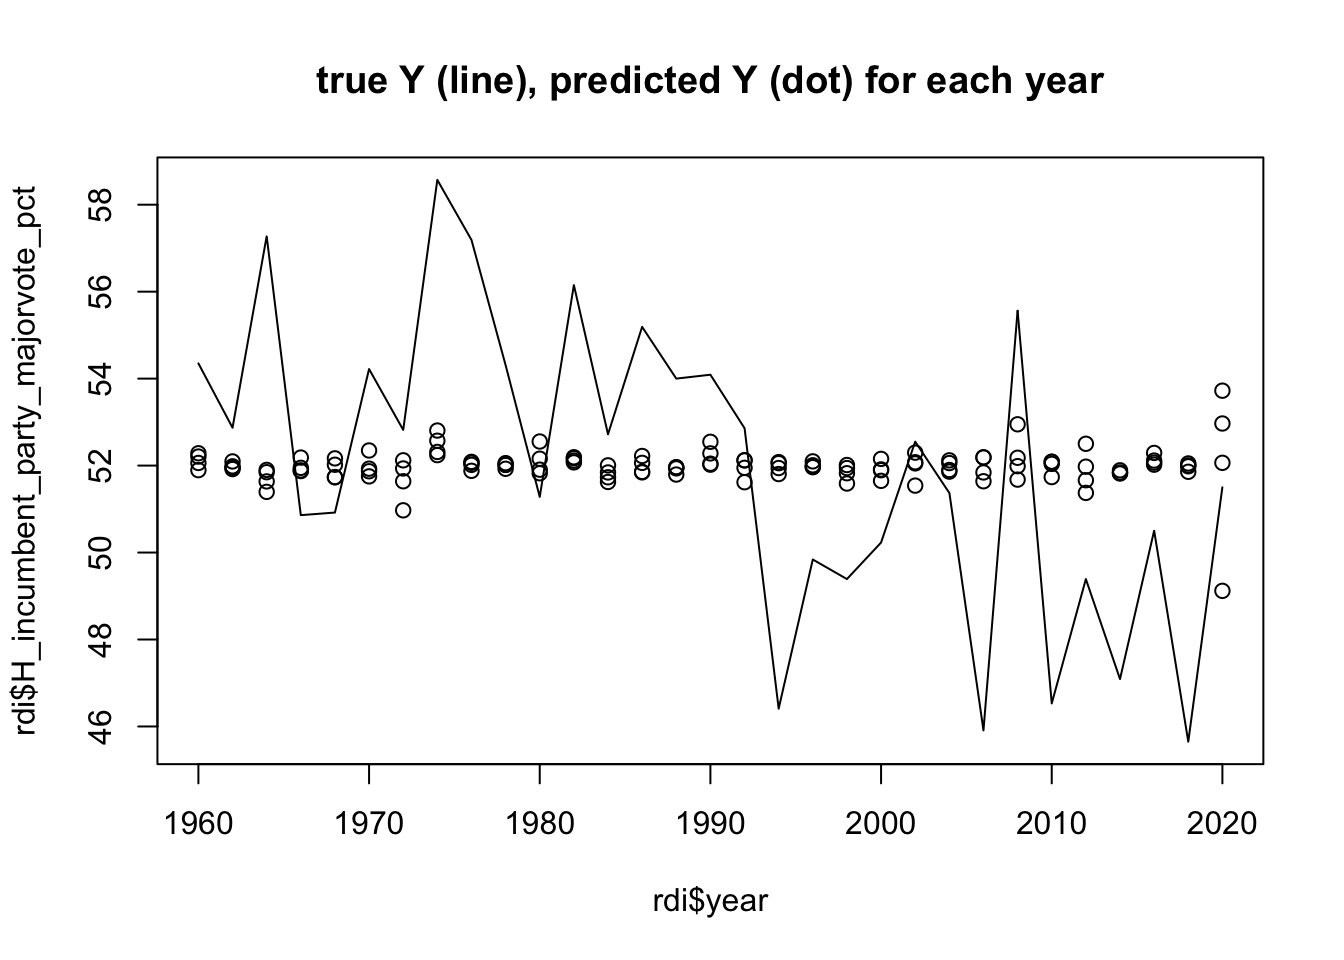 Moving to RDI, there appears a similar trend as with GDP. As the year progresses through economic quarters, the correlation between RDI and incumbency vote share becomes stronger. There seems to be less concentration around the x = 0 line, indicating a relationship between RDI and incumbency vote share. In the combined graph, there appears a significant negative relationship between RDI and incumbency vote share. This is confirmed by the coefficients of the regression. When RDI is zero, the incumbency vote share is 52.27% and decreases at a rate of -0.30% for every 1% increase in RDI. However, the R squared value is still very small, 0.01, indicating this model has little predictive power. Like with GDP, the second graph shows this as the predicted values do not follow the actual values.
Unemployment
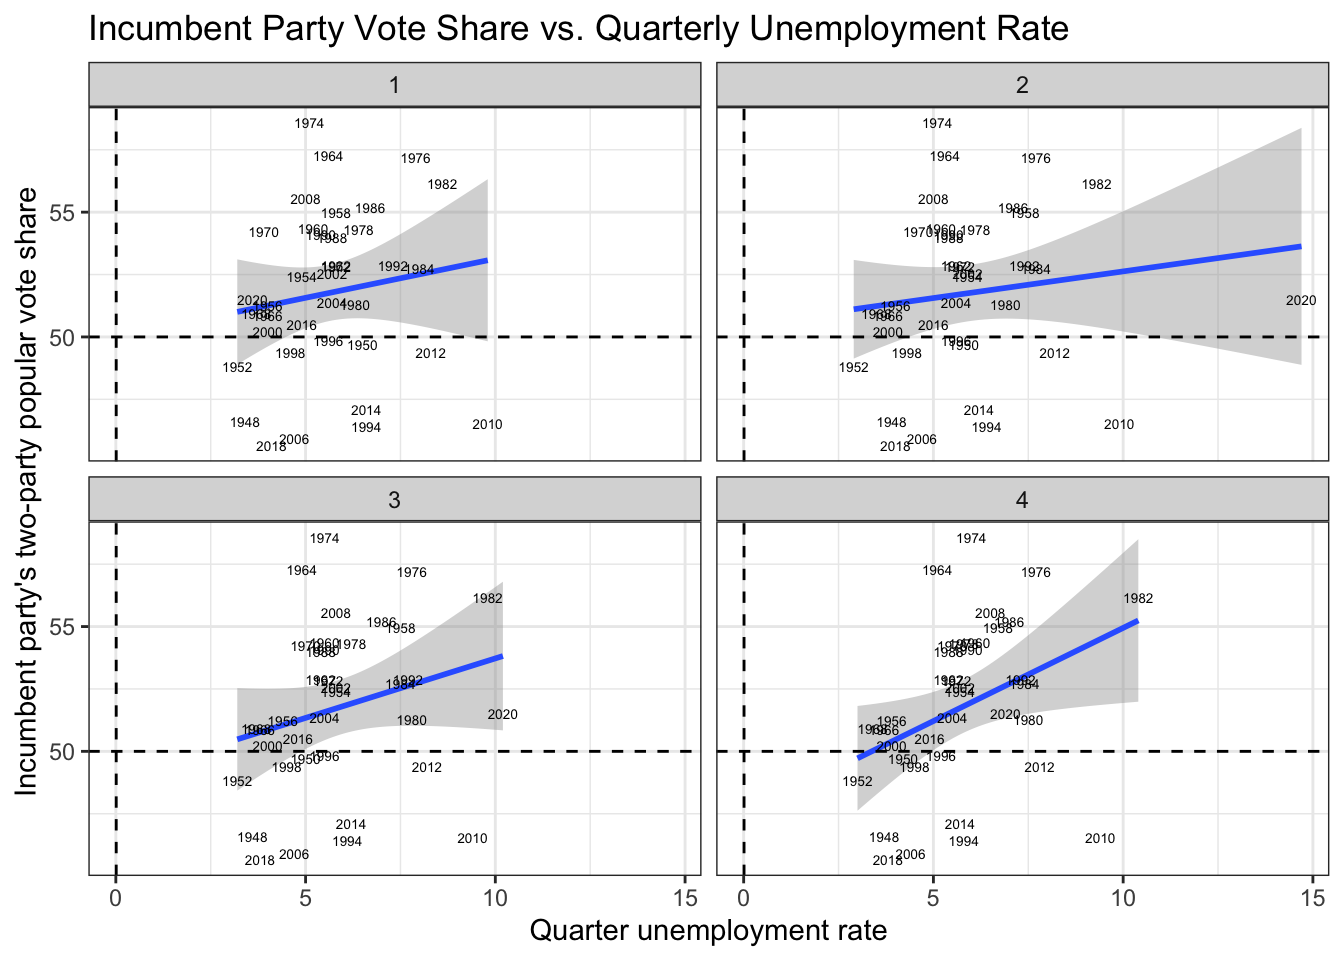
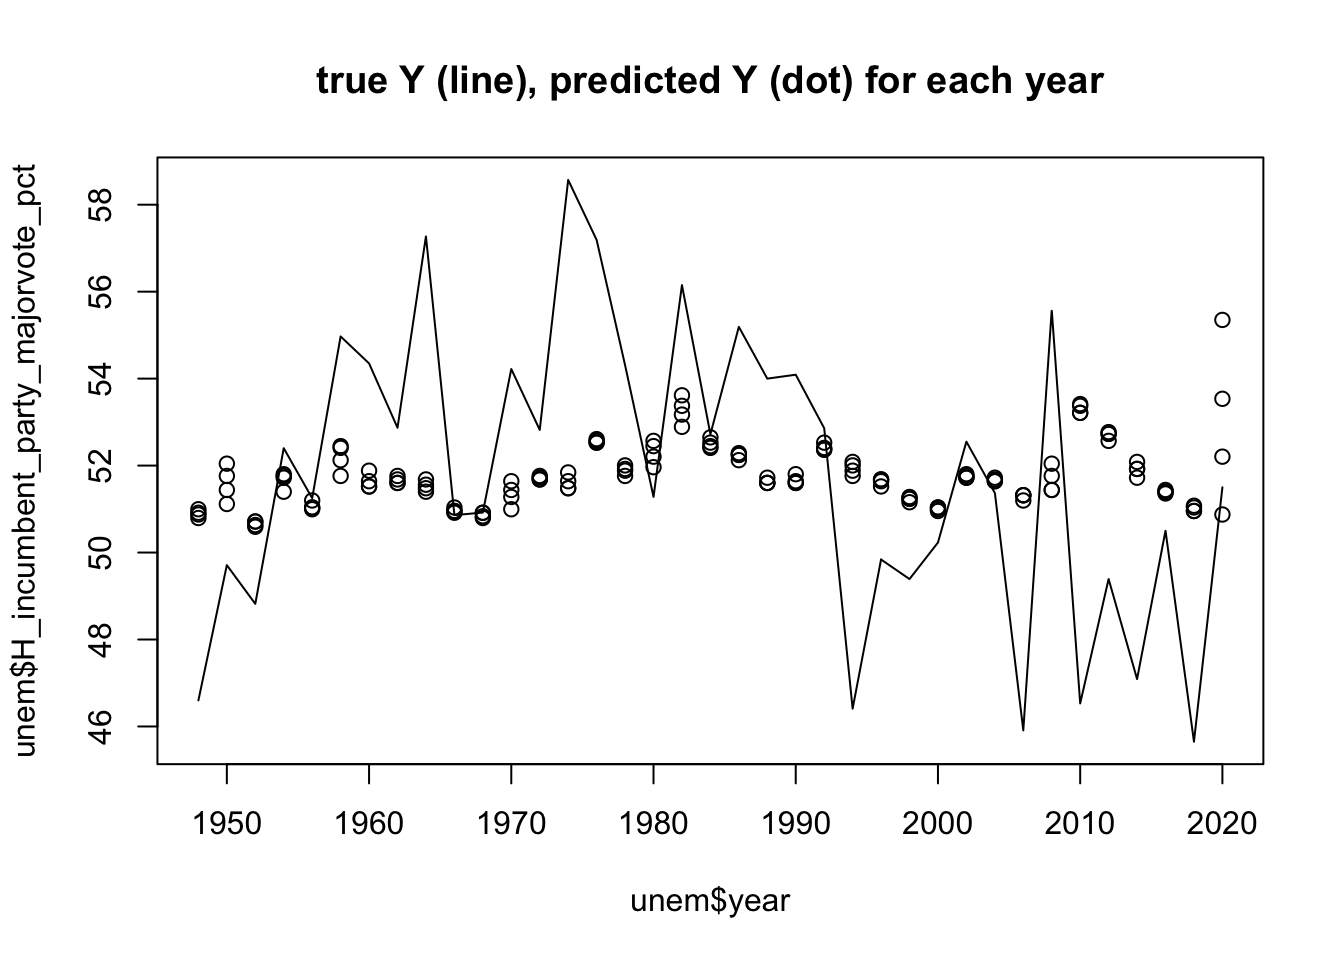 With unemployment, there appears to be a positive relationship between increasing unemployment rate and incumbency vote share. Further, as the quarters progress, this relationship gets stronger. The coefficient of the combined models predicts that if unemployment is zero, then the incumbency vote share would be 49.42%, increasing at a rate of 0.40% for every 1% increase in unemployment rate. This model has the highest R squared value between the variables at 0.046. The second figure shows more similarilty between the trend of the predicted values and the actual values, reflecting the higher R squared value than the previous variables had.
Analysis
After conducting regression analysis on GDP growth, RDI growth, and unemployment rates between the incumbency vote share, unemployment rate had the strongest relationship, with the highest R squared values. This means that unemployment rate is a fairly effective predictor of incumbency vote share. In his piece, “Unemployment and the Democratic Electoral Advantage”, Wright provides insight into why this relationship exists. He argues that for the Democratic party, there is a positive relationship between high unemployment rates and vote share. He claims unemployment rates do not follow a “reward-punishment perspective of economics and elections.” This means that if unemployment is high it does not necessarily mean the incumbent party is punished. Rather, the Democratic party gains from this.
Looking at GDP and RDI, we see a significant shift in the relationship between the economic variable and the incumbent vote share between the earlier quarters and the final quarter. This pattern can be explained by Healy and Lenz in their piece, “Substitution the End for the Whole.” They argue that voters tend to use the last benchmark (like the final economic quarter) as a means of determining how they will vote. With regard to the economic variables of GDP and RDI, this means that there will be the strongest relationship between these variables and incumbency vote share at the end of the election cycle.
Moving Forward
Economic variables can serve as a significant indicator of election outcomes, but it is necessary to identify which variable and the period of time. This data shows that my future models will primarily focus on unemployment rate and use the last economic quarter in my model.