on
Week 3: Polling
In this week’s blog post, I looked at how well polls can determine election results. Although polling is ingrained in the election sphere ambiguity arises around the reliability of the polls and their overall meaning. Considerations such as who is polled, how many people are polled, what the question driving the poll is, and how the poll is interpreted reflect a limited list of ways polls can differ (Gelman and King, 1976). Ultimately, the questions guiding this week’s analysis are: What makes a trustworthy poll? How accurate are polls in predicting vote share? How does this accuracy change as the election approaches?
To answer these questions, I first analyzed two different credited polling methods. The first method from Nate Silver with FiveThirtyEight. The second method from The Economist. For data, I used the historical data of the popular vote for the House between 1948 to 2020 and historical data on the generic ballot polls from 1942 to 2020. I also used FiveThirtyEight’s accumulation of generic ballot polls and house polls for 2020, which includes a methodology rating for each poll. To look at accuracy of polls, I analyzed how the difference between poll predicted vote share and actual vote share changed over as the election grew closer.
Comparison of Polling Models
FiveThirtyEight Model
The FiveThirtyEight model rests on using credible polls to predict outcomes at a local level that sum up to create a national level prediction. FiveThirtyEight creates various levels of models. Their “Lite” version is a polls only model. The “Classic” is a mix of polls and fundamentals. Finally, the “Deluxe” adds expert ratings to the “Classic” model. Due to the heavy reliance on polling, FiveThirtyEight adjusts and weights each poll differently. An example of an adjustment includes converting the results of polls from registered voters to likely voters. The weighting algorithm is FiveThirtyEight’s pollster rating algorithm that analyzes historical accuracy and methodology to weight each poll’s credibility in their model. For fundamentals, the top variables of consideration in this model are the incumbent’s previous margin of victory, the generic ballot, and fundraising.
The Economist Model
The Economist model applies more of a national focus, rather than the local focus the FiveThirtyEight model utilizes. In the Economist model, there is also more of an emphasis on the fundamentals and election theories than polling. The Economist also has adjustments and weighting as part of its model. Different from FiveThirtyEight, The Economist model weights the prediction less depending on the number of days until the election. The fundamentals that this model includes are the type of election (midterm or presidential), unemployment rate, available for reelection, and candidate approval ratings.
Thoughts and Comparison
Both models appear to take slightly different approaches. From these two models, each has important elements that I want to replicate in my model. Within FiveThirtyEight’s model, I think the weighting of polls differently seems necessary to ensure that reliable data is considered more heavily than questionable data. Further, the weighting based on days to the election within The Economist’s model is another factor I would consider. This is because polls appear to gain in accuracy closer to the election, something I discuss later on in this blog. Next, to a varying degree, both include fundamentals and polling in their models. The Economist emphasizes polling less than fundamentals. This would be something I would also want to replicate because polling at a district level can lead to unreliable results due to the high probability of errors with small and less monitored local polling. By including fundamentals, this effect can be minimized. Finally, both models emphasize the role of the generic ballot, which predicts the party’s overall vote share, rather than looking at individual districts, where more irrationality and disparities can arise.
Quality of Polls
When considering polls, determining their credibility is necessary.
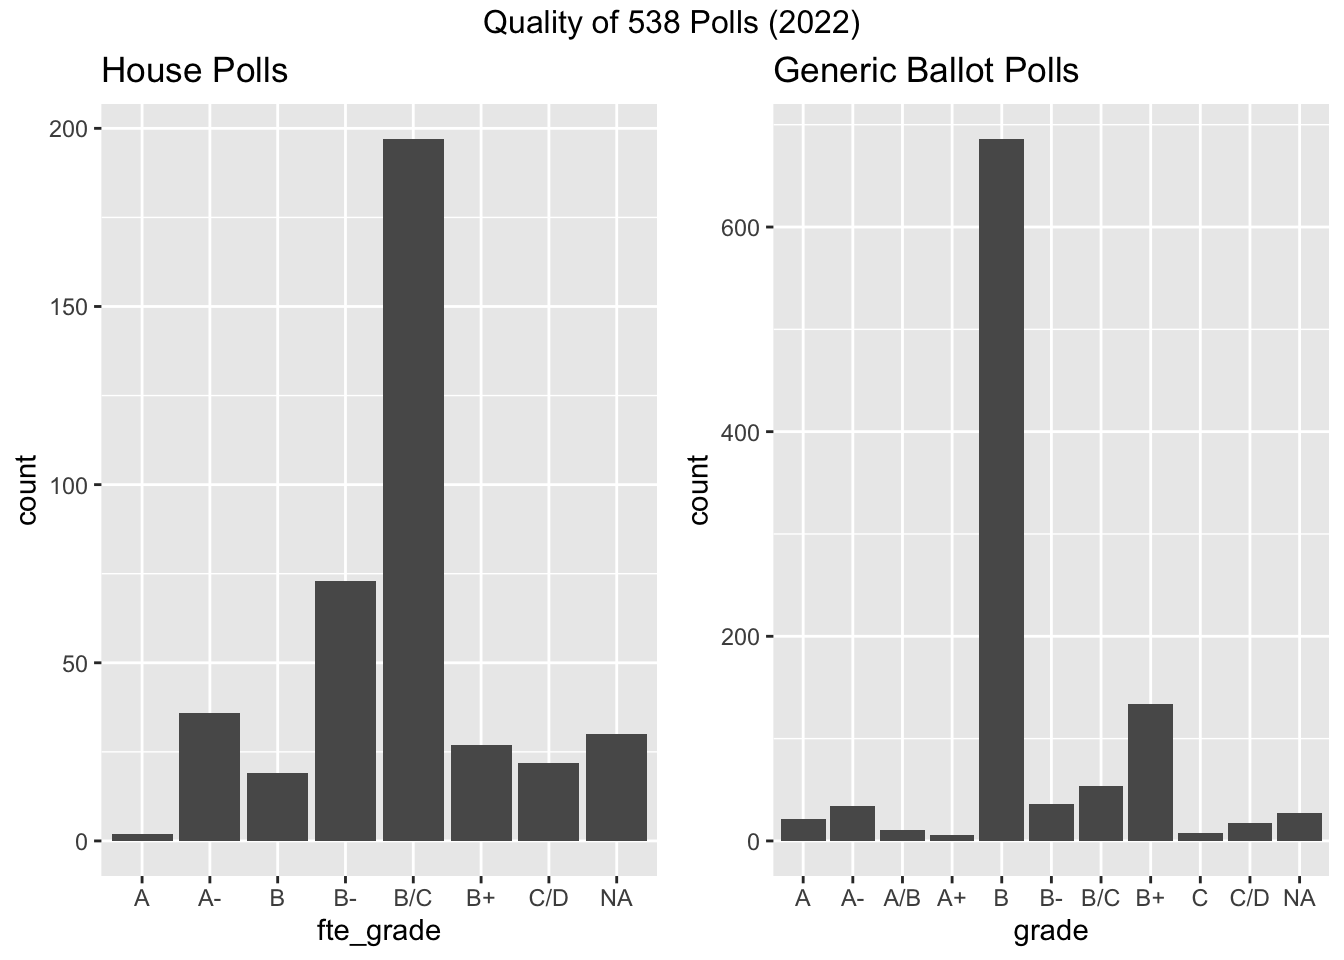 The above charts display FiveThirtyEight’s distribution of grades for the polls they are using during this election cycle. The left shows polls for the House, whereas the right shows the generic ballot. For both poll types, most polls appear to fall around the B range. Although, the generic ballot seems to have a slightly higher median in its grade. This signifies that for the 2022 election, the polls using the generic ballot have slightly more established credibility regarding their methodology and interpretation.
Generic Polls Over Time
Due to this slightly more credible difference with generic polls, I decided to look at the historical data of generic polls and compare it to the actual results of the election. I also looked at only the midterm years after 1998. This is partly due to polling data being consistent after those years and to consider how the electorate may differ between midterm and presidential elections.
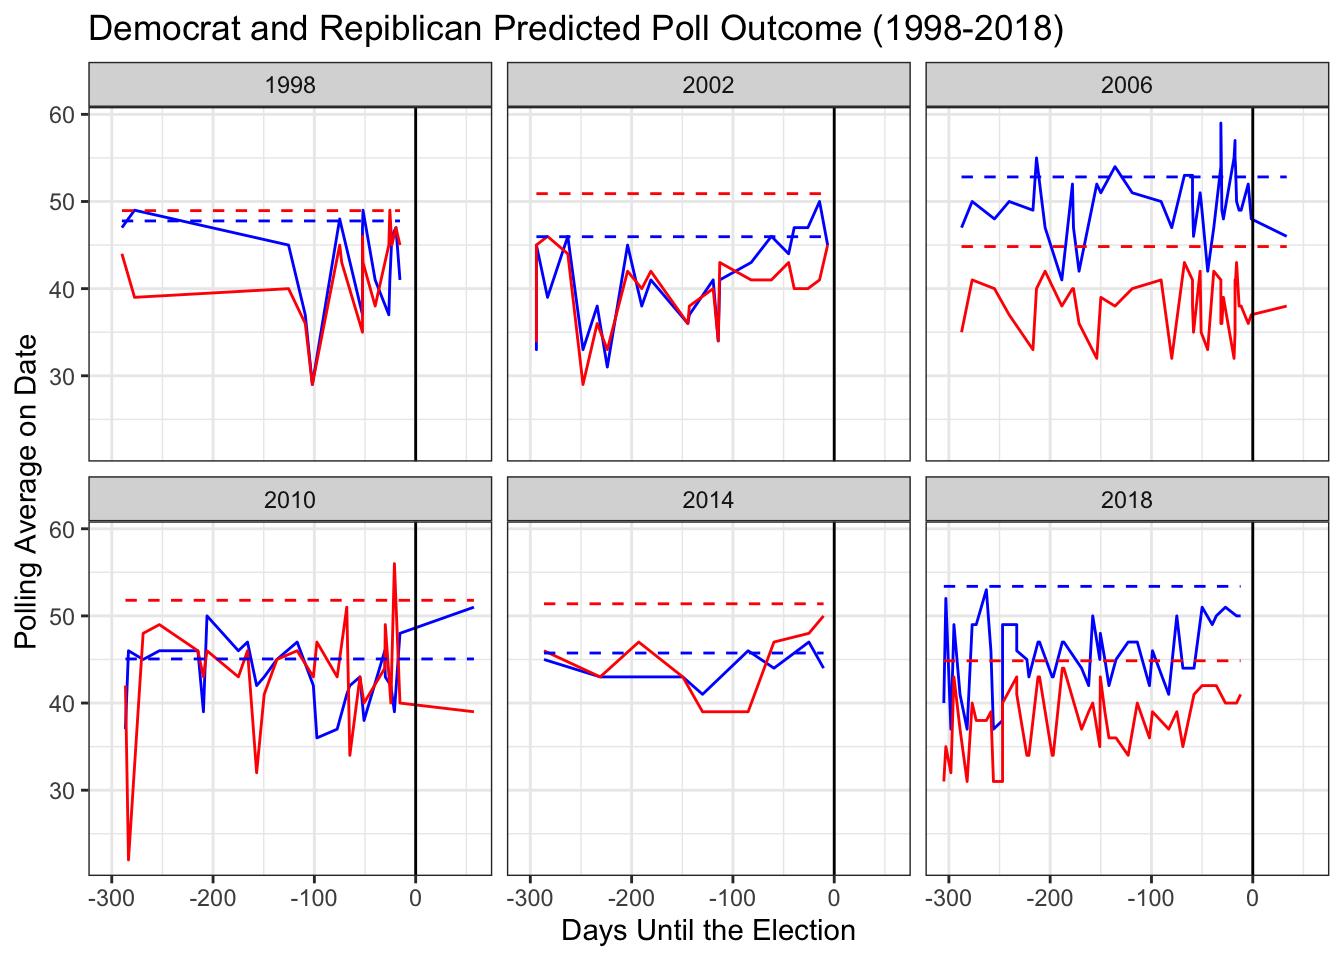
These graphs demonstrate how there is a lot of fluctuation with the outcome of the polls. However, it is difficult to see the trends over time with the accuracy of the polls. The below graphs show the absolute difference between the polls and the actual results.
## `geom_smooth()` using method = 'loess' and formula = 'y ~ x'
## `geom_smooth()` using method = 'loess' and formula = 'y ~ x'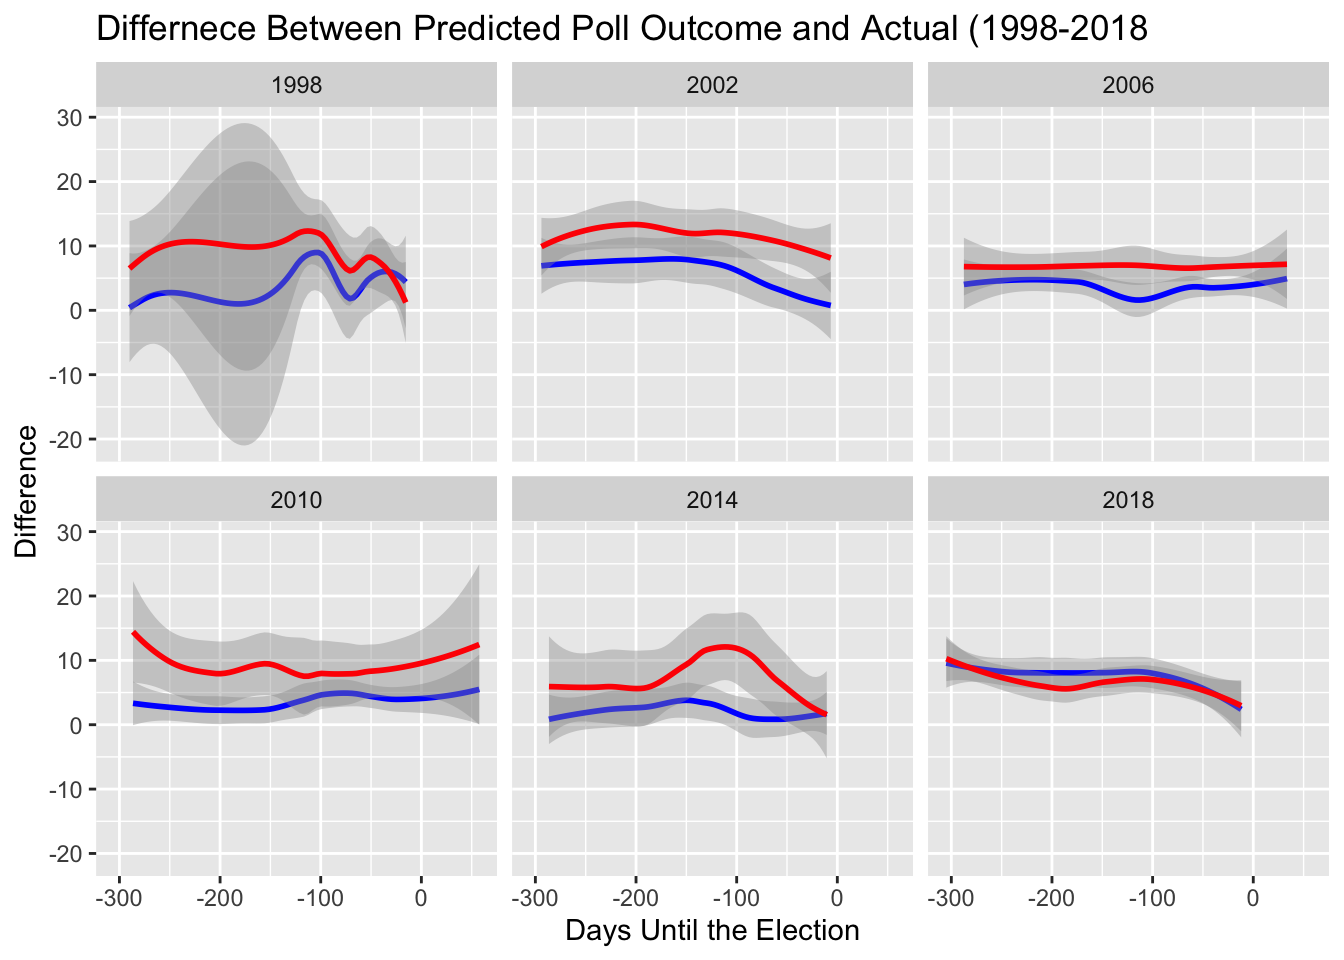 For the midterm year of 2018, there is an evident trend that as days get closer to the election, the difference becomes smaller. This can be seen in other years as well, such as 2002. This idea is supported by Andrew and Gary King who demonstrate that responses to polls are often not well informed or rational at the early stages of the campaign process (Gelman and King, 1997).
Conclusion and Next Steps
After analyzing different polls, my prediction model will consider the general ballot and weight polls closer to the election and polls with a higher grade more heavily. This method, similar to the FiveThirtyEight model, better adjusts for the electorate of midterm elections and ensures the polls are using credible methodology. Additionally, last week I looked at the role of fundamentals in election outcomes and saw that unemployment rates in the third economic quarter appear to most strongly predict the election. This is similar to The Economist model which also uses unemployment as their economic fundamental. From both the analysis of fundamentals and polls as predictors over time, it appeared that the closer to the election, the more valuable of a predictor these variables become. This means that my model will also be dynamic and account for days until the election.